
Big Data
Tracking Digital Traces to Help Students Succeed
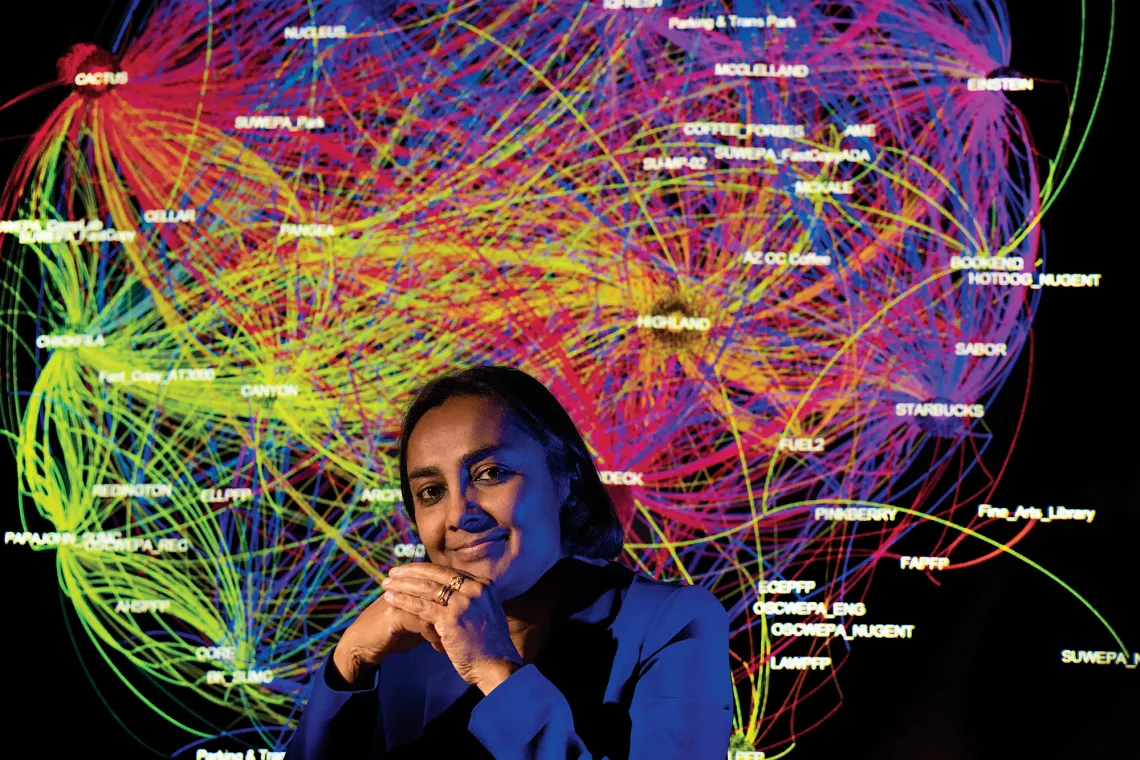
Sudha Ram / Chris Richards photo
Every time University of Arizona students swipe their ID cards — at the student union, the rec center, the library — they leave a digital trace, showing exactly where they’ve been and when.
One UA researcher is tracking those digital traces to see what they reveal about students’ routines and relationships — and their likelihood of returning to campus after their freshman year.
Sudha Ram, a professor of management information systems, directs the UA’s INSITE: Center for Business Intelligence and Analytics in the Eller College of Management. The center focuses on harnessing the power of big data, using machine learning and network science, to help businesses and organizations make better-informed decisions.
The goal of Ram’s Smart Campus research is to help educational institutions re-purpose the data already being captured from student ID cards to identify those most at risk for not returning after their first year of college.
“By getting their digital traces, you can explore their patterns of movement, behavior and interactions, and that tells you a great deal about them,” Ram says.
Freshman retention is an ongoing challenge for public universities nationwide. It’s important not only for the obvious reason — that a university’s goal is to educate students — but also because retention and graduation rates influence a university’s reputation and national rankings. And students’ first two years in college have been found to be critical to their likelihood of completing a degree.
Traditionally, factors such as academic performance and demographic information have been heavily relied on to predict which students are most at risk for dropping out. Ram’s research takes a different approach, focusing on students’ interactions and campus routines.
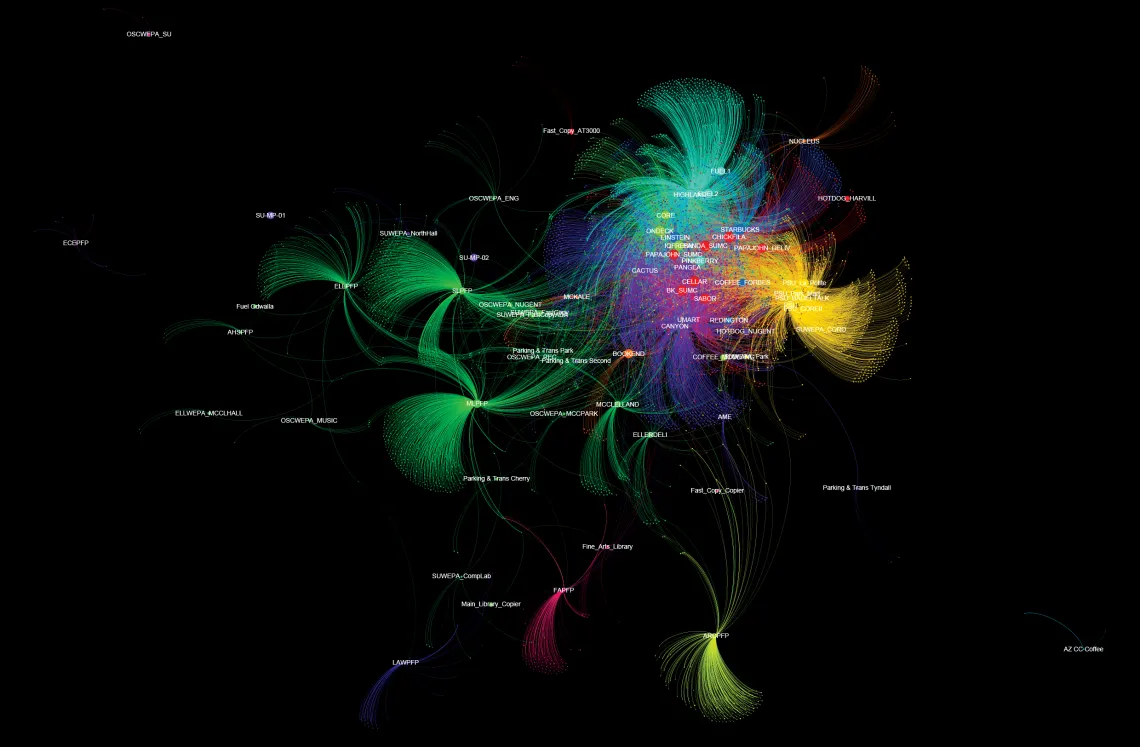
In-state UA freshmen’s traffic patterns in a select area of campus over a weeklong period in the fall. (Image courtesy of Sudha Ram)
Using ID Cards to Track Social Interactions
Students at the UA are issued CatCard student IDs when they enroll. They use the cards at locations including residence halls, the Student Recreation Center, various campus labs, the library and the Think Tank academic support center, to name a few.
Many students also load cash onto the card for use in vending machines and to pay for food and services at the Student Union Memorial Center. The total number of campus locations that accept CatCards is near 700.
“It’s kind of like a sensor that can be used for tracking them,” Ram says of the card. “It’s really not designed to track their social interactions, but you can, because you have a timestamp and location information.”
For example, if Student A on multiple occasions uses her CatCard at the same location and at roughly the same time that Student B uses her card, the pattern suggests a social interaction between the two.
Working in partnership with UA Information Technology, Ram gathered and analyzed data on freshman CatCard usage over a three-year period. She then used that data to create large networks mapping which students interacted with one another and how often. She also looked at how students’ interactions changed over time by constructing networks representing two weeks of data at a time over a 12-week period.
“There are several quantitative measures you can extract from these networks, like the size of [a student’s] social circle, and we can analyze changes in these networks to see if their social circle is shrinking or growing, and if the strength of their connections is increasing or decreasing over time,” she says.
Ram additionally used the CatCard data to look at the regularity of students’ routines and whether they had fairly established patterns of activity during the school week. She and her collaborators developed a machine learning algorithm to determine ways to quantify these patterns.
Considered together with demographic information and other predictive measures of freshman retention, an analysis of students’ social interactions and routines was able to accurately predict 85 to 90 percent of the freshmen who would not return for a second year at the UA, with those having less-established routines and fewer social interactions most at risk for leaving.
“Of all the students who drop out at the end of the first year, with our social integration measures, we’re able to do a prediction at the end of the first 12 weeks of the semester with 85 to 90 percent recall,” Ram says. “That means that out of the 2,000 students who drop out, we’re able to identify 1,800 of them.”
Ram found that social integration and routine were stronger predictors than end-of-term grades, one of the traditionally used predictors of freshman retention in higher education.
The problem with relying solely on grades for making predictions is that national literature suggests freshmen who ultimately leave the university make the decision to do so in the first 12 weeks of the 16-week semester, and often as early as the first four weeks — long before final grades are posted, Ram says.
“A public university like ours is very large, and students can get lost,” Ram says. “There are social science theories that indicate that when these students come in, they need to establish a regular routine, learn how to manage their time, and they need to get socially integrated. Those are some of the reasons they tend to drop out — they’re not socially integrated and they haven’t established a regularity of routine on campus.”
Retention: An Age-Old Issue in Higher Ed
Ram’s research represents a new approach to an old problem, and she hopes it can eventually be used by the UA and other universities to supplement the predictive analytics work they are already doing.
“Student retention is something that’s been studied for the last 30 or 40 years, but we never had the ability to track people’s behavior and movement and extract their social integration patterns,” Ram says. “We have also made great strides in developing machine learning and large-scale network analysis methods that help in analyzing such spatiotemporal data.”
Ram’s work comes at a time when universities nationwide, including the UA, are committing more resources to harnessing data analytics in ways that support student success.
“The kind of move that universities are making toward predictive analytics and using more data to understand the student experience allows us to look earlier and more often at some of the variables that we can get our hands on and ask different sorts of questions than we were able to ask before about the freshman experience,” says Vincent J. Del Casino Jr., UA vice president for academic initiatives and student success.
The UA, which saw its freshman retention rate jump from 80.5 to 83.3 percent between 2016 and 2017, has for the past four years contracted with outside vendor Civitas Learning for data analysis related to retention and graduation rates.
The university now uses some 800 data points — related to everything from academic performance to financial aid to students’ activity in the university’s D2L course management system — to identify which students are most at risk for leaving. Those predictions, which do not include data from Ram’s research, are about 73 percent accurate from the first day of classes, with the rate of accuracy improving over time, says Angela Baldasare, UA assistant provost for institutional research.
The university’s current effort to predict first-year student retention is a significant improvement over previous models, which relied largely on descriptive data from surveys and incoming freshmen’s “academic index scores,” predictions of their first-year college GPA based on their high school GPA, the difficulty of the courses they took in high school, and their SAT or ACT test scores.
The university now generates lists, based on those 800 data points, twice a semester and twice in the summer of the 20 percent of students most at risk in each college. Those lists are shared with the colleges with the intent that advisers will use them to reach out to students who may need additional support or guidance, Baldasare says.
“As early as the first day of classes, even for freshmen, these predictive analytics are creating highly accurate indicators that inform what we do to support students in our programs and practice,” she says. “The lists of students are delivered in the fourth week of classes because we know students may already be making up their minds about staying or leaving the UA.”
The university also is preparing to launch an online dashboard where advisers can access key data and assess student risk in real time throughout the semester.
“We’ve really worked hard over last year to work more with advisers and get advisers better data so we can facilitate their informed action with students,” Baldasare says.
Predictive analytics merely provide a signal for underlying challenges students might be facing, Baldasare notes. It’s up to the advisers on the ground to use that information to diagnose the problem and help students as best they can, with the understanding that it will never be possible to retain everyone.
“What all of this ultimately boils down to is individual students and individual needs and how we translate the big signals down into individual outreach,” Baldasare says.
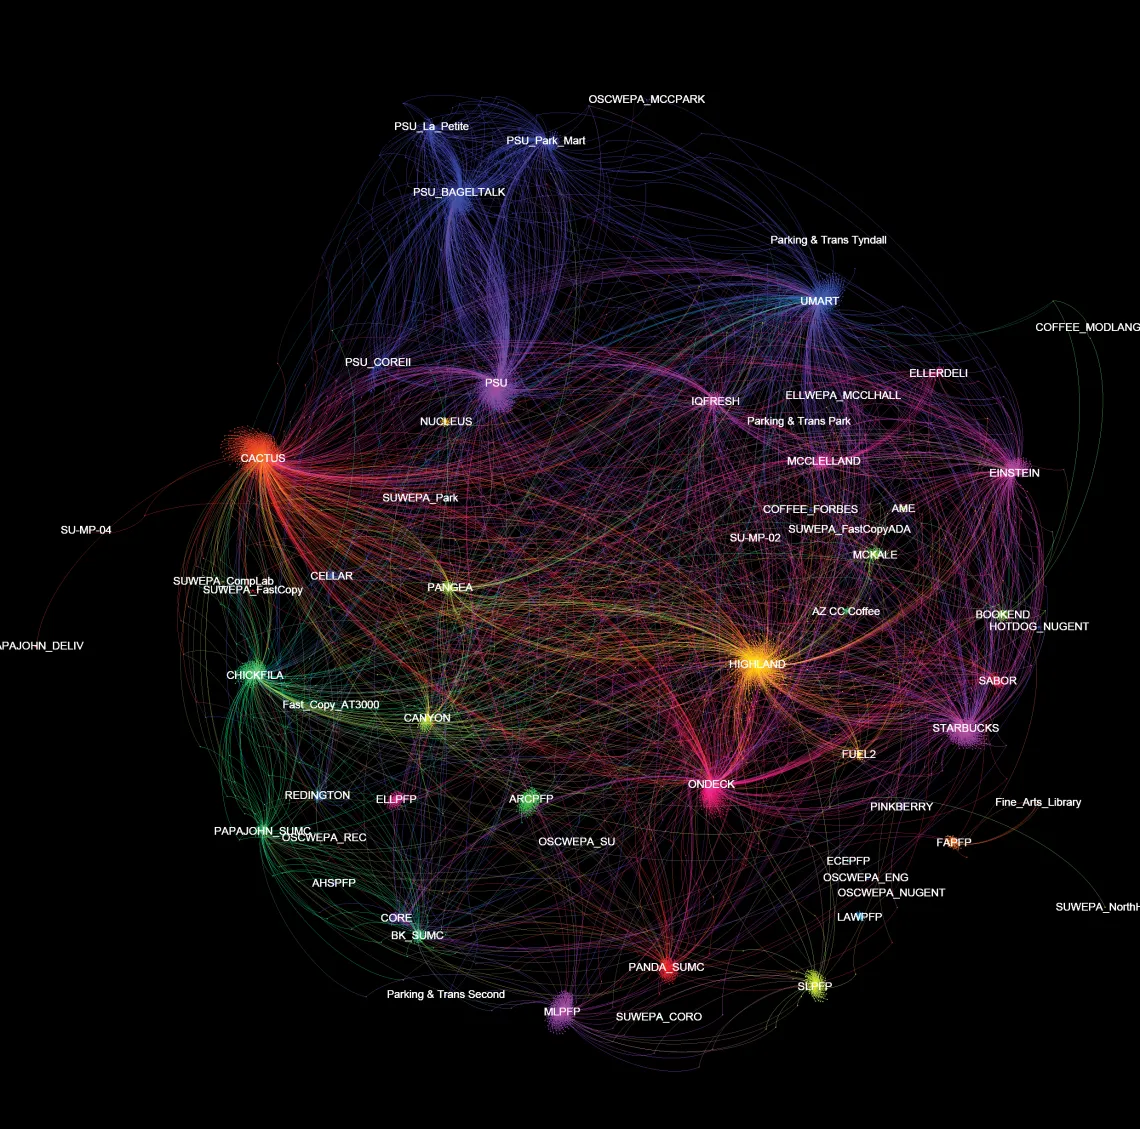
This data visualization shows the traffic patterns of UA freshmen, as told by their CatCard usage, in a select area of campus between 10 a.m. and 2 p.m. on a weekday. (Image courtesy of Sudha Ram)
Big Data Allows Better Responses, Sooner
That individualized approach is at the heart of Ram’s Smart Campus work, which Baldasare hopes may eventually be incorporated into the predictive work the UA is already doing.
Ram says generalized solutions are no longer enough — in any industry.
“We live in an era where you shouldn’t be generalizing about groups of people,” Ram says. “You should be personalizing solutions at the individual level.”
That thinking underlies many of Ram’s projects, ranging from her health care research to identify high-cost hospital patients at the point of admission to her Smart Cities work in Fortaleza, Brazil, which aims to tackle public transportation challenges. These and other research projects take on societal challenges to produce solutions with policy and social implications by harnessing the power of big data, large-scale network analysis and machine learning techniques.
Coming up with targeted solutions is possible today more than ever before, thanks to what Ram refers to as the “datafication phenomenon” — our ability to measure and quantify things that we couldn’t in the past, from students’ interactions on campus to the number of steps it takes to walk to work in the morning. Those data are generated continuously from many different sources, often with a precise time and location associated with them.
“My philosophy in doing prediction modeling is to combine signals from many different sources to understand the problem,” Ram says. “We now live in a sensing environment. We live in an environment where everything is connected, so our whole world is even more than an ‘internet of things’ — it is an internet of people, data and things. It’s all three connected to each other, and it’s all about understanding those connections. This is where network science and machine learning interact and allow us to make better predictions.”
Just as Amazon boasts of having a 360-degree view of the customer — being able to predict what an individual will buy before they do it — so too can other organizations leverage data to predict and respond to the evolving needs of those they serve, Ram says.
“We don’t live in a static world. Our preferences change, our behavior changes, what we do changes, our whole life changes,” Ram says. “When you look at data, you can see longer-term trends and follow what people are thinking and respond to that in real time in terms of offering new services and new products. And you can do interventions and see immediate reactions to these interventions and say, ‘This was a good way to do it; this was not.’ So you’re able to make decisions in a lot shorter time — better decisions — and then you can measure whether your decisions are working or not.”
In the case of freshman retention, intervention needs to come early to be most effective, whether it is an email from an adviser or perhaps an invitation from the adviser for the student to participate in a time management seminar or some other activity that could boost social interaction.
“We think by doing these interventions by the 12th week, which is when students make up their mind, you’re sort of doing what Amazon does — delivering items you didn’t order but will be ordering in the future,” Ram says.
Building the Future You Want
Predictive analytics get even better the more data you have, Ram says. For her Smart Campus research, she hopes to eventually be able to incorporate UA Wi-Fi data from the 8,000 hubs on campus to get an even more accurate picture of students’ movement and behavior.
Ram acknowledges that there are privacy concerns when dealing with individuals’ personal information. That’s why the CatCard data she collected were completely anonymized so that she could not personally identify individual students by name, ID number or any other attribute. That information ultimately would be shared only with the students’ adviser.
“Almost every prediction we make is personalized — without knowing who the individual is,” Ram says.
In the end, Ram believes the potential benefits — getting students the individualized attention and support they need, while helping the institution meet its goals — make the process worthwhile.
The same goes for any industries leveraging the power of big data and predictive analytics to make better decisions for themselves and those they serve.
“It’s all about thinking about the future,” Ram says. “It’s about planning for the future and making sure you’re doing things in a way that enables the future to happen the way you want it — for everyone’s benefit.”


